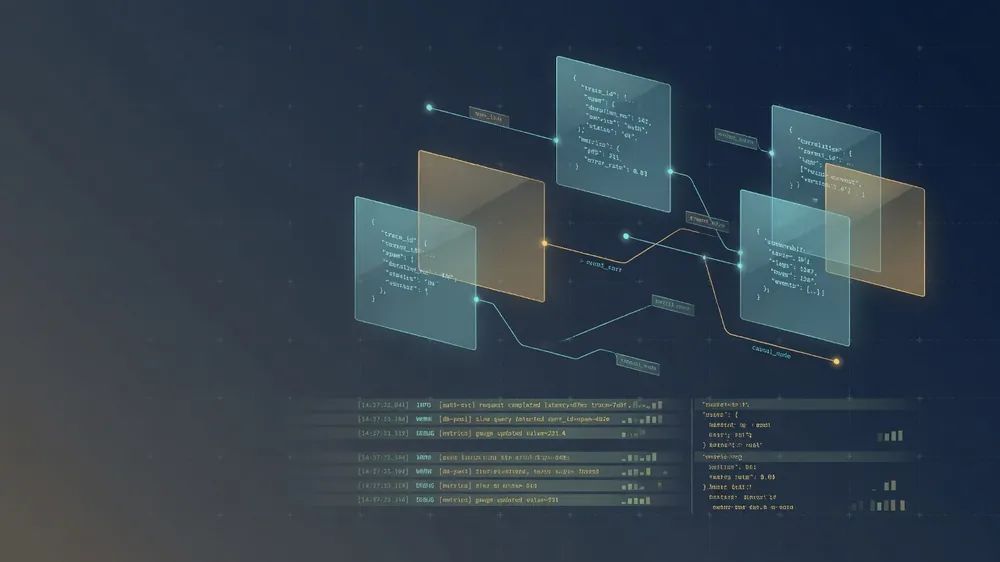
Unstructured plain-text logs are an operational liability during production outages. Emitting structured JSON logs with correlation IDs enables immediate filtering across distributed services.
This is the checklist I want on every production service: JSON (or equivalent), correlation IDs, honest levels, no raw PII, and strict rules on high-cardinality fields. Skip the theory catalog. Ship the habits that cut mean time to understand.
Why structure beats slogans
A line like Error processing payment for user 42 is readable in a terminal. At 3 a.m. with five microservices and a flaky dependency, you need:
- every event that belongs to one request across services
- filters on
status_code,error_code,service,envwithout grepping poetry - dashboards and alerts that do not break when someone rewords a message
Structured logging gives you fields. The human message stays, but it is no longer the only interface.
Typical shape (field names vary by team; pick a convention and keep it):
{
  "ts": "2026-01-31T14:22:01.234Z",
  "level": "error",
  "msg": "payment capture failed",
  "service": "billing-api",
  "env": "prod",
  "version": "1.8.3",
  "trace_id": "4bf92f3577b34da6a3ce929d0e0e4736",
  "span_id": "00f067aa0ba902b7",
  "request_id": "req_8f3c2a",
  "user_id": "usr_9k2m",
  "order_id": "ord_441",
  "error_code": "GATEWAY_TIMEOUT",
  "duration_ms": 3201,
  "http": {
    "method": "POST",
    "path": "/v1/payments/capture",
    "status": 504
  }
}
Same keys on success and failure. Same nesting style. That is what makes queries and alert rules boring, which is the point.
Emit JSON (or a stable key-value format)
Prefer one log line = one JSON object on stdout/stderr. Let the platform (Fluent Bit, Vector, CloudWatch agent, Datadog agent, etc.) ship and index. Do not invent a custom multi-line format unless you have a hard reason.
Practical rules:
- One event per line. Multi-line stack traces either go in a single JSON string field (
stack) or get attached by the shipper. Broken lines that split mid-JSON are dead weight. - ISO-8601 timestamps in UTC (
tsor@timestamp). Local time in logs is how you lose an hour every DST change. - Stable schema for core fields.
level,msg,service,env,version, correlation IDs. Add domain fields next to them, not under random top-level names each sprint. - Libraries, not
print. Usestructlog,zap,slog,pino,logbackJSON encoder, or whatever is standard in the stack. Configure once at process start.
Minimal Python sketch with structlog ideas (any library with the same idea works):
import logging
import structlog

structlog.configure(
    processors=[
        structlog.contextvars.merge_contextvars,
        structlog.processors.add_log_level,
        structlog.processors.TimeStamper(fmt="iso", utc=True),
        structlog.processors.JSONRenderer(),
    ],
    wrapper_class=structlog.make_filtering_bound_logger(logging.INFO),
)

log = structlog.get_logger()
log.info("order_created", order_id=order.id, amount_cents=amount)
Node with pino is the same contract: objects in, JSON out, child loggers for request context.
Avoid free-form string interpolation as the primary record:
# Bad: only a string; hard to filter safely
logger.info(f"order {order_id} created for {email}")

# Better: message + fields
logger.info("order_created", order_id=order_id, user_id=user_id)
Keep msg short and stable (order_created, payment_capture_failed). Put variables in fields. That keeps cardinality of the message low while still giving you dimensions to query.
Correlation IDs: follow one request across the mesh
When service A calls B and B calls C, plain logs on each host do not tell a story. You need an ID that travels with the request.
Two common patterns (often both):
| ID | Role |
|---|---|
trace_id / span_id |
OpenTelemetry / distributed tracing. Best when you already have traces. |
request_id / correlation_id |
App-level UUID set at the edge (API gateway or first service) and passed on every hop. |
How it works in practice:
- Edge (or first service) reads
X-Request-Id/traceparent. If missing, generate a UUID. - Put that ID into logging context for the request (context var, MDC, middleware child logger).
- Propagate the same header (and W3C
traceparentif you use OTel) on outbound HTTP/gRPC/queue messages. - Every log line in that request path includes the IDs automatically. Call sites should not pass them by hand every time.
# Middleware pseudo-code
request_id = request.headers.get("x-request-id") or str(uuid4())
structlog.contextvars.clear_contextvars()
structlog.contextvars.bind_contextvars(
    request_id=request_id,
    trace_id=extract_trace_id(request),
)
# All logs in this request now carry request_id / trace_id
Queue workers and cron jobs need the same discipline. For async work, put request_id / trace_id on the message payload or headers when you enqueue. For crons, generate a job_run_id at start and bind it for the run.
If you only do one thing this quarter: correlation IDs end to end. Everything else is nicer; this one changes incident response.
Log levels that mean something
Levels only help if the team agrees what they mean. A useful default for services:
| Level | Use for |
|---|---|
| ERROR | Request or job failed in a way that needs attention. Operator or on-call may act. |
| WARN | Degraded but recovered or recoverable: retry succeeded, fallback used, near limit. |
| INFO | Business-meaningful milestones: request completed, job finished, config loaded. |
| DEBUG | Detail for local or temporary prod diagnosis. Off by default in prod (or sampled). |
Rules that prevent alert fatigue:
- Do not log ERROR for expected client mistakes (validation 400, auth 401 from bad tokens). Use INFO or WARN with
statusanderror_code. ERROR is for your system failing or an upstream that breaks the request when it should not. - One ERROR per failure path, not one ERROR per retry attempt plus a final one. Retries can be DEBUG/WARN; the terminal failure is ERROR.
- INFO should not flood. Prefer one completion log per request with
duration_msandstatusover "start", "mid", "end" noise. High QPS services often sample INFO or rely on metrics for volume and logs for failures + sample of success. - DEBUG in prod only behind a flag, a header, or a short-lived config change. Leaving DEBUG on for a chatty path is how you burn the log budget in an afternoon.
Map library levels carefully. Some frameworks treat "warn" as default for deprecations. Tune them so your dashboards match human expectation.
PII and secrets: never log the raw value
Logs outlive the request. They land in third-party SaaS, cold storage, support tooling, and laptop exports. Treat them as a data store with weak access control until proven otherwise.
Never log:
- passwords, API keys, tokens, session cookies, Authorization headers
- full payment card numbers, CVV, bank account numbers
- national IDs, passport numbers, full health records where regulation applies
- raw request/response bodies that may contain any of the above
Usually redacted or tokenized:
- email, phone, full name (prefer
user_idas the join key) - IP address (policy-dependent; often hashed or truncated)
- street address, precise geo
Patterns that work:
# Prefer stable opaque IDs
log.info("login_ok", user_id=user.id)

# If you must include an email for support tooling, hash or partial-mask
log.info("invite_sent", email_domain=email.split("@")[-1])  # or hmac_sha256(email, pepper)
Defense in depth:
- Allowlist fields at the logger boundary for HTTP bodies and headers. Deny by default.
- Redaction middleware on common header names (
authorization,cookie,x-api-key). - Code review checklist: new log lines that include
payload,body,headers, or user profile fields get a second look. - Retention and access: shorter retention for debug-heavy indexes; restricted roles for production log search.
A leak in logs is still a leak. "We only keep logs 7 days" does not fix a secret that was indexed and copied.
Cardinality: the silent cost driver
Cardinality is how many unique values a field can take. Log platforms often bill on volume and build indexes or facets on fields. High-cardinality fields explode cost and kill query performance.
| Field | Cardinality | Notes |
|---|---|---|
env, service, level, http.method |
Low | Safe facets |
http.status, error_code, region |
Low-medium | Usually fine |
user_id, order_id, request_id |
High | Keep for search; avoid as metric labels |
msg with interpolated IDs |
Extreme | payment failed for order 123 × millions |
| full URL with query string | Extreme | Path template instead: /users/{id} |
Rules:
- Stable
msgvalues. Usepayment_capture_failed, notpayment capture failed for order {id}. Put the id inorder_id. - Path templates, not raw URLs. Middleware should normalize
/users/42to/users/:id(or your framework's route pattern) for the field you chart. Keep the raw path in a separate field only if you accept the cost. - Do not turn every log field into a metric label. Metrics want low-cardinality dimensions. Logs can hold
user_idfor find-by-id queries; Prometheus labels should not. - Bound unbounded strings. Truncate exception messages and third-party error bodies (e.g. 2 KB). A 2 MB HTML error page in a log field is a self-inflicted outage for the shipper.
- Sample hot paths. Health checks every second from every replica: drop or sample aggressively. Same for successful GETs on a read-heavy endpoint if metrics already cover traffic.
Cardinality mistakes show up as "our log bill doubled after we added better logging." Better logging is not more unique strings. It is better fields.
What to put on a request completion log
One solid INFO (or DEBUG when sampled) line at the end of a request beats five half-written lines:
request_id/trace_idhttp.method, route template,http.statusduration_msuser_idor auth subject if applicable (opaque id)error_codewhen status >= 400- maybe
bytes_out,db_queries, or feature flags when those are common debug hooks
Errors get a second line or the same line at ERROR with error.type, error.message (sanitized), and optional stack.
Outbound calls: log client name, target service, status, duration, and correlation IDs. That is how you see which dependency burned the latency budget without opening three repos.
Context binding beats parameter soup
Thread or request-scoped context keeps call sites clean:
request start -> bind request_id, user_id, route
   service code -> log.info("inventory_reserved", sku=sku, qty=qty)
   ...
request end -> log completion; clear context
Without binding, every helper either omits correlation fields or takes a log_ctx argument forever. Clear context at the end of the request so worker threads or async tasks do not leak IDs into the next job.
Align logs with metrics and traces
Logs answer "what happened for this id." Metrics answer "how often / how slow." Traces answer "where time went across services."
- Prefer metrics for rate, latency, saturation (RED/USE). Do not invent a log line only to count it later.
- Prefer traces for multi-hop latency. Logs should carry
trace_idso you can jump from a log hit to a trace UI. - Prefer logs for rare events, error detail, and audit-style facts that need payload context (still redacted).
If your only signal is logs, every question becomes a full-text search. That works until it does not.
A short production checklist
Use this in code review or a new service template:
- JSON (or equivalent) on stdout, one event per line, UTC timestamps.
- Core fields on every line:
service,env,version,level,msg. - Correlation:
request_idand/or W3C / OTel trace context on every hop, including queues. - Levels: ERROR for actionable system failures; not for routine 4xx.
- No secrets or raw PII; prefer opaque ids; redact headers and bodies by default.
- Low-cardinality messages and routes; high-cardinality only as search fields, not metric labels.
- Completion log with status and duration; sample success on hot paths if volume hurts.
- Library configured once; no ad-hoc
printor string-only logging in new code. - Retention and access documented; debug indexes not treated like a free data lake.
Common failure modes
| Symptom | Likely cause |
|---|---|
| Cannot stitch a user complaint across services | Missing or dropped correlation headers |
| Log bill spikes after a "small" change | DEBUG left on, health checks logged, or interpolated msg |
| Alerts fire on user typos | 4xx logged as ERROR |
| Security review finds tokens in ELK | Body/header logging without allowlist |
Queries time out on user_id facets |
High-cardinality field used as a default index/facet |
| Stack traces split across lines and break JSON | Multi-line output without a single-field stack |
None of these need a new vendor. They need conventions and a few lines of middleware.
Closing
Structured logging is not a format debate. It is an operations contract: every service speaks the same field language, carries IDs across boundaries, refuses to dump secrets, and keeps cardinality under control so search stays fast and bills stay boring.
Start with JSON + correlation IDs + level policy + redaction. Add fancy sampling and schema registries when the basics hold under load. When the next incident hits, you want one request_id query, not five greps and a hope.